
The Intersection of Finance and Data
It wasn’t long ago when you would hear about craft breweries “struggling to keep up with demand” with beer being sold as soon as it was packaged. The product just disappeared and the brewery didn’t have to ask many questions. As a result, the operation was prioritized over all other functions of the business, ensuring that first and foremost, the beer got made and sent out the door. Now, with the exception of a few unicorns and new product launches in their infancy, those days are over. Today’s competitive pressures put forth a Cheesecake Factory-sized menu full of challenges to navigate 🧭. To stay on track, I recommend pinpointing your GPS to:

As always, I come from the perspective of a regional craft brewer who adopts the 3-tier system as it’s primary business model. We share the challenges of the largest breweries in the country, just at a smaller depth and scale. But we’re also a Brewpub and Taproom with a small, but meaningful direct-to-consumer side of the business. The two models are wildly different, but share a quickly growing need for advanced thinking and utilization of all data within reach.
Three Sets of Books
Sales for breweries through the 3-tier system are referred to as Shipments (to distributors). At the point that beer is picked up or shipped to the wholesaler, the sale is recorded on the brewery’s financials. Pretty simple and straight forward, however the beer still has to deplete, or get sold & delivered 🚚 to a retailer. Depletions clear the way for the next shipment. Then finally the beer has to pull-through, getting sold to end customers, to keep the cycle flowing.
In the short term, sales (shipments) mean very little about the brewery’s financial success, though over the course of a year, they dictate “top-line” success and rank amongst their peers. Depletions are a better indicator of the future as they’re tied to the support from retailers and connects one step closer to the end consumer. At the end of the day though, the beer has to pull.
Being a leader in finance doesn’t mean you wait and see what happens, then compile and communicate the results. Instead, you stay on top of all three sources of data, which are a constantly moving target 🎯, to anticipate the future and make adjustments to your plan along the way. Control the controllable and get ahead, before it’s too late. Thankfully, all the data behind shipments, depletions, and a meaningful sample of your pull-through data can be obtained…for a price.

Custom illustration by Em Sauter of Pints & Panels. Follow her on Twitter and her beer education-focused illustrations on Instagram.
Shipment Data (Shipments & Direct sales)
Revs/BBL
While shipments aren’t the best indicator of the future, they’re crucial combined with direct sales, in their linkage back to production costs. But before thinking about the cost of beer, I like to start simple with the stat: Revs Per Barrel (💰Revenue/Beer Barrels Sold). Certainly not the be-all and end-all, but an important metric to keep tabs on. With multiple business models happening within an organization, some focusing on volume (distribution) and others on margin (retail), leaders need as much detail as possible. I recommend breaking sales out by business unit like this made-up example below of a brewery with two taprooms.
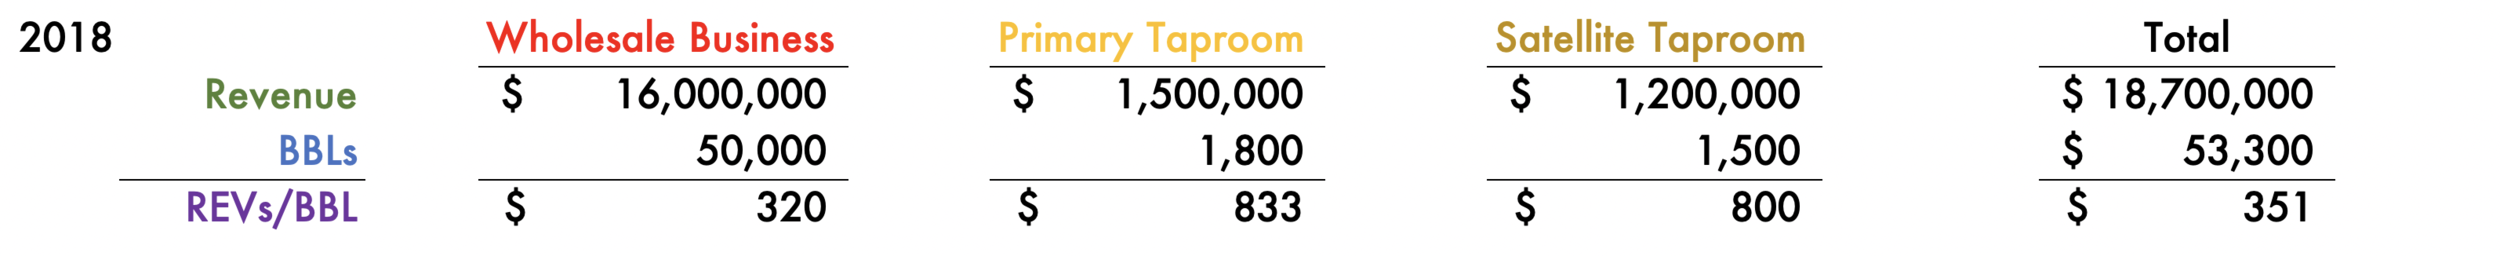
This health-check should be done annually, if not quarterly, but will fall on deaf ears without a comparable benchmark. I recommend expanding the analysis to bump it up against the prior year and evaluate the swings. Perhaps barrels produced are rising 📈, but Revs/BBL are falling 📉, suggesting that volume has become more of a focus (Distribution business, 12-packs, etc.). Alternatively, barrels could be going down 📉, which will become common in 2019 & 2020, but Revs/BBL are rising 📈. That could be an indicator of pushing pricing on the consumer. Dissecting shifts in Revs/BBL over time serves as an important exercise to evaluate and validate price and volume strategies, ensuring that there’s a healthy mix of both.

Gross Margin
After gaining a handle over revenue as it relates to production, it’s time to bridge direct costs into the equation. Arriving at Gross Margin [Sales - Costs of Goods Sold] for the brewery overall is pretty easy, however that information alone won’t help with strategy. Accurately tracking these inputs by batch and SKU, no matter how sophisticated the accounting software, is a big challenge. The process requires diligence, consistency, and a big picture understanding from all members of the team, not just accountants. Garbage in, garbage out 🗑️.
Today there are more variables than ever going into the average recipe, each adding to the complexity of planning and tracking costs. Some have always been around including the gravity of the beer, choice of malts (specialty, imported, etc.), pounds/BBL in the dry-hop, and the specific choice of hop varieties. Others ingredients are becoming more common to the equation like spirit barrels, maple syrup, vanilla beans, etc. Regardless of the combination, none of these inputs have a simple straight-forward cost and instead depend on whether they’re bought in bulk or not (i.e. bag of grain vs. silo of grain), as well as other factors. The sheer scale of a batch can be the difference of whether the margins work or not, especially through distribution.

When it comes to packaging, the world used to be a much simpler place. Most craft breweries used to have one or two formats, most commonly a 6-pack and a 22oz bottle. Choosing the appropriate packaging and price point was a more straight-forward process. Nowadays however, consumers have become so segmented that breweries are finding their way into new shapes and sizes in order to cater to more occasions. Likewise, the constant desire for NEW has brought forth the need for more flexible packaging to accommodate the higher quantity of small batches. Whether it’s sleeved cans or sticker cans, the costs often run 3 to 4X compared to their printed can equivalent. The trade-off being low order minimums.
Finance has the opportunity to step up here by building and maintaining models that help put these decisions to the test, ensuring that unprofitable decisions aren’t unknowingly “green lit” 🚦. Combining the following factors to arrive at the Gross Margin will tests the viability and value-add of a new beer/SKU being proposed:
Bright Beer Cost Data for All Recipes, along with a means to input an estimate for a proposed beer.
Cost Data For Each Packaging Option and any Volume Restrictions (i.e. Minimum Can Buys)
Desired Price Point to the End Consumer
Distributor & Retailer Margins, Freight, and Tax
Projected Volume
Implementation of a dynamic spreadsheet like this will lead to more informed decisions, as opposed to shooting from the hip. Sharing this process beyond the top decision-makers helps build a better understanding and appreciation for all the variables that go into a decision and leads to a higher success rate for new ideas down the road.
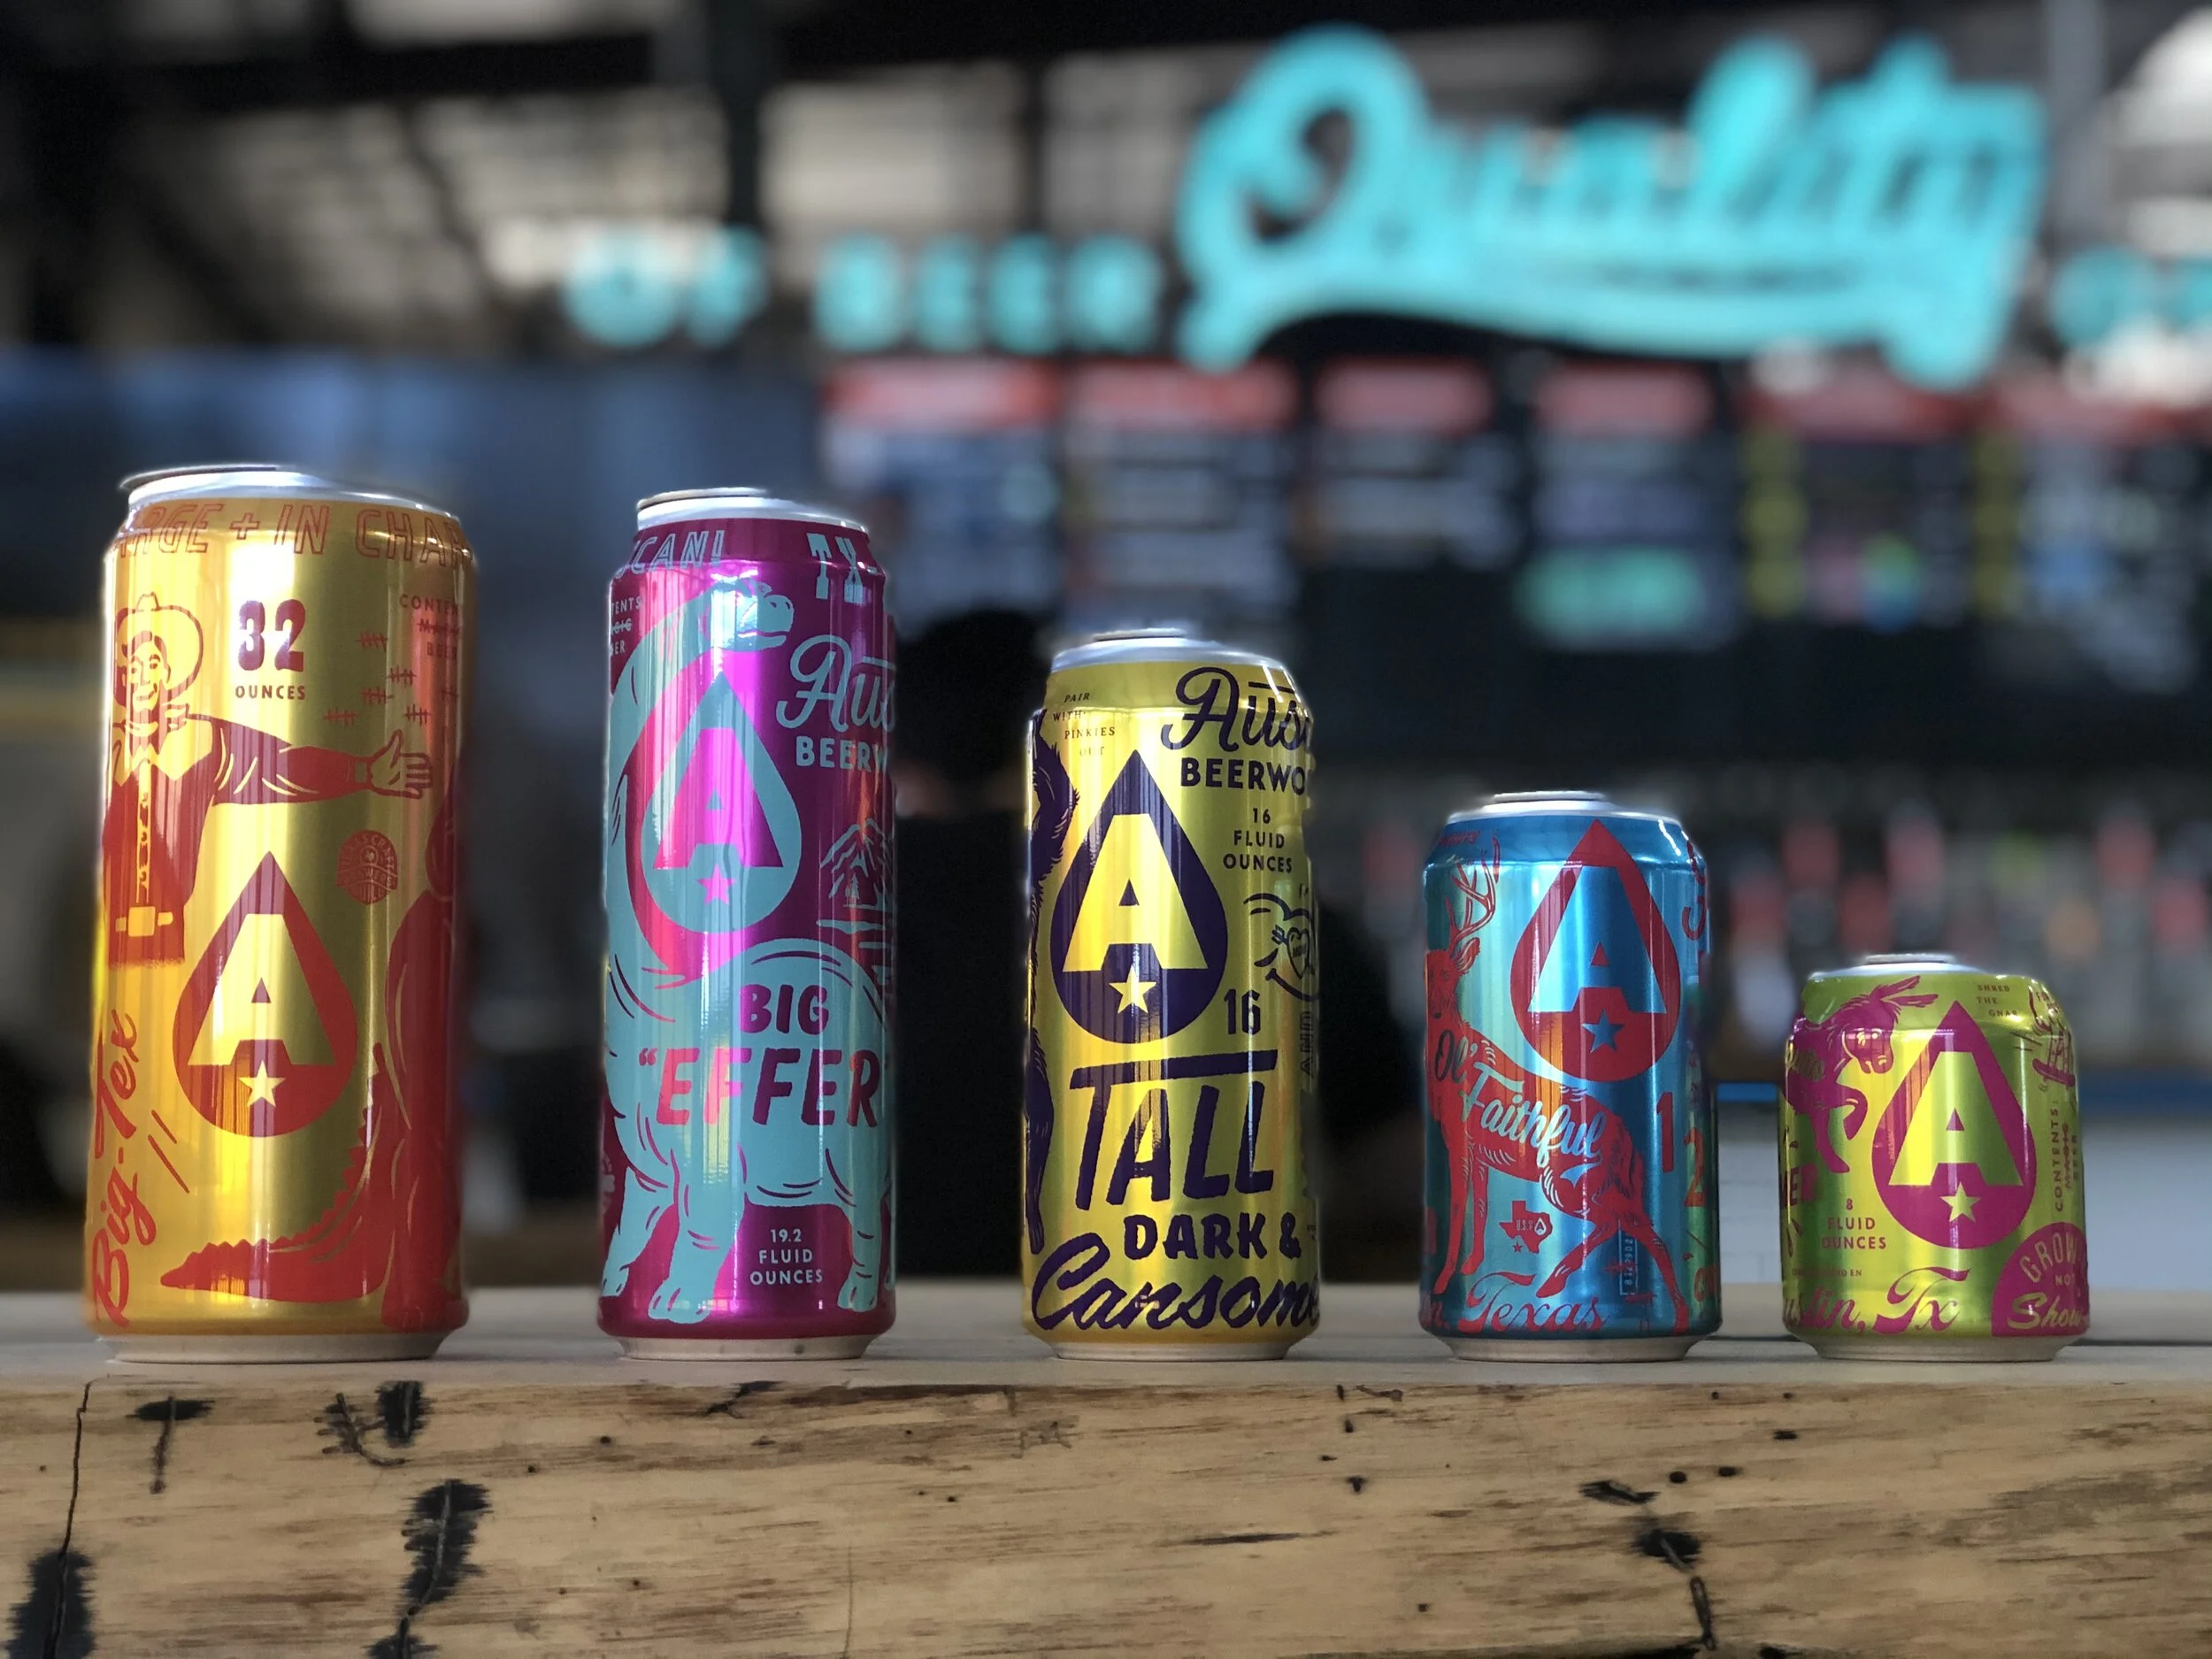
Photo Credit: Kristyn Goff of Austin Beerworks
Yield & Loss
From the brewhouse, to the fermenter, to the bright beer tank, all the way to the packaging line, beer is being lost at each turn along the way. There’s a never ending list of equipment add-ons out there that help increase your yield. With more money than ever being spent on specialty ingredients 💸, increasing the amount of finished beer from the same amount of inputs can be a fruitful area to focus in on.
The capital improvements in question have the opportunity to pay for themselves in short order by calculating the amount of “free beer” that would result. You’d then extrapolate that against your production plan, convert to an average cost/value per barrel, and determine if the breakeven point is worth the investment and hit to cash flow. By focusing on these improvements the cost per barrel goes down and gross margin goes up.
While the technical skillset to identify and implement these investments calls on the brewery and operations teams, finance has the opportunity to provide confidence in the decision by evaluating the R.O.I, Break-Even Point, and Cash Flow impact. None of this can be done without reliable production data.
Depletion Data (Sales From Distributors to Retailers)
Rate of Sale & Days on Hand
Thankfully, there’s a common set of ERP systems used by distributors and as a result, suppliers (breweries) can subscribe to their underlying data and have it aggregated in one convenient reporting interface. Ready access to depletion data provides a number of benefits for the brewery’s production, logistics, sales, and in turn, finance teams. For starters, knowing how much of each beer/sku is sitting in the distributor’s warehouse is a big advantage. Rather than communicating in cases 📦, the status is typically converted to a number of Days On Hand. In other words, at the current Rate of Sale (Avg. # of Cases Sold in a Day), how many days worth of inventory does the distributor have? Think of Days on Hand as the count down until when product will run out at the distributor.
Keeping a close eye on Days on Hand is a primary objective of both the sales team and the individual(s) planning a brewery’s production. With date-sensitive, hop-forward beers, you don’t want to be sitting long, because that means you’ll have old beer on the shelf. For more on this, visit an old post called “Out of Code: Why Freshness Ain’t Easy”. But financially, you (and distributors) don’t want Days on Hand to get too low either and risk the dreaded Lost Sale(s). So it’s a delicate balance between never running out and avoiding too much inventory. Nailing the timing of brews with the timing of trucks and Days on Hand at each distributor is a beautiful art that leads to positive reputations with your wholesale partners, retailers, and consumers.
Seasonal Example
A seasonal beer like an Oktoberfest tends to get brewed in June, to be packaged six weeks later. Most of that beer gets shipped immediately to a distributor meaning those sales hit the brewery’s financial statements in late July/early August. But it’s what happens in following months that determines your destiny.
Thanks to the ability to tap into distributor depletion data to monitor Days on Hand & Rate of Sale, breweries have the tools to optimize their production. If the Summer seasonal sold well, those dedicated shelf spots are nearly empty and ready for Oktoberfest to slide right in. As a result, depletions get off to a fast start to the point that there may be time to brew another batch (or more). By contrast, if the Summer seasonal was a dog and still all over the shelves and stacked on the floor, that fresh Oktoberfest is blocked with nowhere to go.
Sitting long on Oktoberfest due to a poor Rate of Sale will inevitably stretch its season to the max and delay the load-in of the Winter seasonal. November and December are great holiday months to sell beer and screwing up this window is not how anyone wants to finish their year. Getting an early beat on depletion data helps predict success, nail the timing & size of production, and maximize the financial opportunity.

Points of Distribution (PoDs)
Before I worked hands-on in the beer industry, I would always think of a brewery’s success to be dependent on the consumer’s desire for the beer. In other words, if the brewery did a good enough job creating interest or eduction on social media, that the sales would follow. I’ve since learned just how backwards that line of thinking can be outside of small direct-to-consumer models. Once a certain size is reached, it’s all about distribution. Not in the holistic meaning of the term, but literally how many shelves your product is on, which we call PoDs (Points of Distribution). While I may know what beer I want to buy when I’m heading to the store or bottle shop, that’s not how most beer shopping is done. If the beer isn’t on the shelf, most won’t find it.
PODs provide a deeper layer of insight into depletion data. Consumer interest could be very weak, but if PODs continue to be gained left and right, depletions might continue looking healthy (for now). Adding Per Point of Distribution analyses will paint a more accurate picture and help identify if there’s a pull-problem (the beer ain’t selling).
Velocity
Velocity is the rate at which a product sells. How many kegs/month does that bar sell? How many cases/week does the bottle shop move through? Velocity is an important metric for finance to be on top of because of its future implications 🔮. Something I see and hear a lot right now with draft beer is not necessarily a loss in distribution (tap handles), though that is certainly a concern, but a decline in velocity. The brewery still has a tap handle at the bar, they’re just not moving through as many kegs as they used to. This could point to a more systematic trend for the brewery’s on-premise (bar) sales, which are competing more and more with Netflix.

Scan Data
The least timely and complete of the three sources of data is pull-through, or scan data, which represents the beer actually selling to an end customer. Companies like IRI Worldwide and Nielsen Global Connect compile, organize, and sell this data back to the brewery as a service. While the results don’t include kegs, scan data does provide an accurate view to those who rely on major chains to support their scale. Like I said at the beginning, you can ship all the beer you want and if you have the distribution and relationships, you can get it into stores. But at the end of the day, it still has to sell.
Finance needs to be closely in tune with scan data because it can provide early indicators of slowdowns or pick-ups that may not be as evident yet through shipment and depletion data. It’s also the primary means to gauge competitors and the market overall. While larger breweries have the luxury of seeing how many cases are at their distributor, they don’t have that line of sight when it comes to retailers. If the scan data shows a brand beginning to hit a wall, adjustments need to be made to accommodate for the imminent slow down in shipments, especially if a new innovation is not in the pipeline.
% ACV
Similar to PoDs, % ACV is a metric built-off the population of available retailers that a brewery could sell in, but uses Scan Data to calculate and is weighted for volume. In the craft beer world, nobody quite gets to a 100% ACV, but the ceiling for something ubiquitous like Sierra Nevada Pale Ale is a lot closer than the ceiling of a year-round barleywine. Regardless, it’s important for Finance, not just Sales, to have an understanding of when a product is nearing full distribution, often referred to as being “fully baked.” Once there’s no new shelves for the product to go, the next step is to make it turn (sell) faster. This means planning for price decreases or increased marketing spend, both of which take a lot of planning. I heard the wise David Walker of Firestone Walker say at CBC a few years ago, “If you’re not working on next year’s plan in May, then you’re already behind.”
The Final Turn
I speak to a lot of accountants, both from breweries and other professions, who don’t find their job fulfilling. As I peel back the onion though, I learn that they’re often waiting for a more strategic opportunity at the company to just fall in their lap. I try to explain that they hold the keys to so much great information that can add value and bridge gaps between departments. Don’t wait for someone to come up with these ideas for you. Chat up your colleagues, put your thinking cap on, and make them happen. Showing the initiative is what will vault you to the next level of trust and responsibility. If you’re feeling lost, there’s a truly endless amount of opportunity at the Intersection of Finance & Data. Get going.